Casual Notebooks and Rigid Scripts: Understanding Data Science Programming
This webpage contains supplementary material for the paper "Casual Notebooks and Rigid Scripts: Understanding Data Science Programming" by Krishna Subramanian, Nur Hamdan, and Jan Borchers. The four supplementary materials are below:
- Details of our formative study participants and the data we collected from them.
- Details of our Grounded Theory analysis, including the codebook and our procedure.
- Phases in data science programming
- Design recommendations
For questions, please contact
1. Details of our formative study participants and the data we collected from them
| Participant | Experience with the scripting language (in years) |
Domain (scripting language) |
Modalities | IDE(s) used | Interview & walkthrough (in minutes) |
Observation (in minutes) |
| P01 | 1 | Significance testing (R) | Scripts | RStudio | 15 | 45 |
| P02 | 2 | Significance testing (R) | Scripts | RStudio | 20 | 35 |
| P03 | 1 | Significance testing (R) | Scripts | RStudio | 20 | 25 |
| P04 | 1 | Significance testing (R) | Scripts | RStudio | 15 | 30 |
| P05 | 2 | Machine learning (Python) | Notebooks | Jupyter notebooks | 20 | 20 |
| P06 | 5 | 3d data processing (Python) | Scripts | Blender | 40 | - |
| P07 | 3 | Significance testing (R) | Scripts | RStudio | 30 | 40 |
| P08 | 2 | Machine learning (Python) | Both | PyCharm | 30 | 50 |
| P09 | 0.5 | Financial analysis (R) | Both | RStudio | 40 | 60 |
| P10 | 3 | Machine learning (Python) Significance testing (R) |
Both | RStudio, Jupyter notebooks | 60 | 45 |
| P11 | 1 | 3d data processing (Python) Numerical analysis (MATLAB) |
Scripts | PyCharm | 20 | 30 |
| P12 | 2 | Equation modeling (R) Significance testing (R) |
Scripts | RStudio | 55 | - |
| P13 | 1 | Machine learning (Python) Significance testing (Python, R) |
Both | RStudio, Jupyter notebooks, PyCharm | 55 | 30 |
| P14 | 5 | Machine learning (Python, R, MATLAB) | Both | PyCharm, Jupyter notebooks, RStudio, MATLAB | 30 | - |
| P15 | 3 | Machine learning (Python) | Both | Textmate, Jupyter notebooks | 40 | - |
| P16 | 10 | Machine learning (Python, R) | Both | Spyder, Jupyter notebooks, RStudio | 60 | - |
| P17 | 3 | Machine learning (Python, MATLAB) | Both | MATLAB, Jupyter notebooks, Sublime | 45 | - |
| P18 | 7 | Numerical analysis (MATLAB) |
Scripts | Vim, MATLAB | 40 | - |
| P19 | 8 | Numerical analysis (MATLAB, Python) |
Scripts | MATLAB | 60 | - |
| P20 | 5 | Machine learning (Python) | Scripts | PyCharm | 45 | - |
| P21 | 8 | Significance testing (R) Machine learning (Python) |
Scripts | RStudio, PyCharm | 55 | - |
2. Details of our Grounded Theory analysis
See ![]() this document.
this document.
3. Phases in data science programming
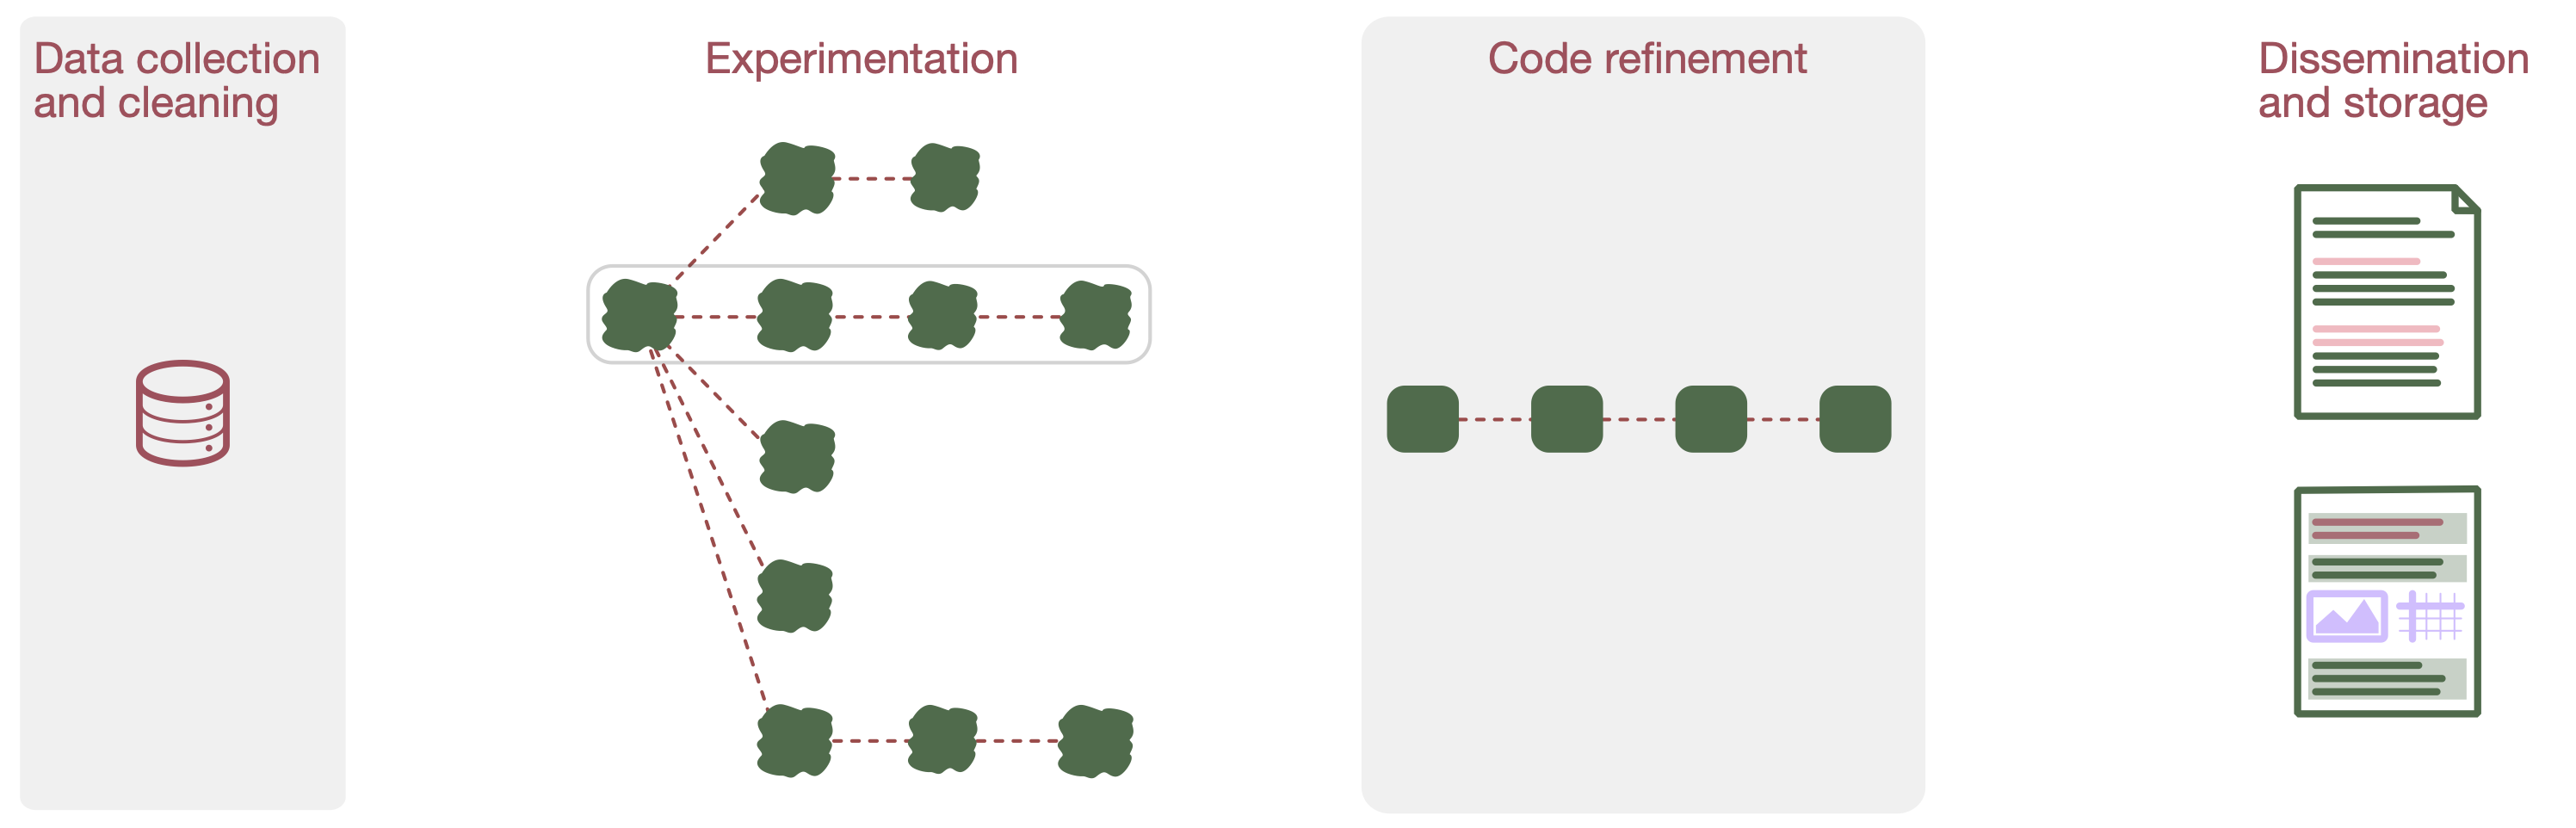
We identified four phases in data science programming:
I. Data collection and cleaning
In this first phase, participants collect and clean data. Data is mostly collected by another person (P02, P03, P06, P08, P09, and P12–19), sometimes by the participants themselves (P01, P04, P07, P10, P16, P20, and P21); public data was used otherwise (P05. P11, and P16). After collecting data, participants prepare the dataset for analysis, e.g., by converting it to the right format and removing outliers. Data cleaning takes a lot of time, and is a recurring task done throughout analysis.
II. Experimentation
Participants often experiment with different approaches to obtain insights from their data. These approaches are implemented as "quick and dirty" prototypes in the source code, often in a less modular, reusable manner. In this phase, the data science workflow is highly iterative and unpredictable—experiments lead to comparisons, comparisons generate even more ideas to explore, and so on. For comparisons, our participants employed various criteria, e.g., code metrics like execution time and memory, but also domain-dependent criteria like statistical power (P04) and results of a fitting function (P10).
III. Code refinement
To prepare the source code of the analysis for dissemination, participants (a) improve the readability of source code by adding further documenttion and pruning "scratchpad" code (P02–P04, P07, P09, P10, and P13), (b) refactor source code either in-place or into a new script file or computation notebook to improve code quality and reusability (P02–04, P08, P10, P13, and P15), and (c) extend source code so that it works with a wider range of input (P08 and P13; this was more common in machine learning).
IV. Dissemination and storage
The final phase in data science programming is to disseminate the results of the analysis to the outside world, e.g., as a research publication, or store it for later reuse. All participants reported disseminating the insights from their analysis, as well as storing their source code for later reuse. Many disseminate source code (P05, P08, P09, P11, and P13–19), although in some situations only as snippets or pseudo-code (P08, P09, and P13–17).
4. Design recommendations
Resolving short-term issues
In the short-term, data workers face several issues as a result of using both modalities. Source code often gets cloned within or across files, requiring data workers to maintain clones, e.g., by linked editing. Constantly switching modalities also means that data scientists have to understand their source code and state of their experiments whenever they switch. This problem is exacerbated by sparse documentation and prevalence of unstructured exploratory code. On a related note, it can be difficult for data workers to navigate and find prior code, which is a frequent task during experimentation to begin new experiments, as well as when refining source code for dissemination or storing. Automatically-generated source code visualizations, such as Code Bubbles, Code Thumbnails, and TRACTUS, could help with code understanding, navigation, and task resumption.
Improving reproducibility
Scientific claims gain credibility when the researcher provides enough details so that the findings can be reproduced by an independent researcher. When refining code for dissemination, data workers often rewrite their exploratory code. When doing so, data workers need to capture not just the source code that produced the reported approach, but also the approaches that were explored earlier which led to the final approach. Data workers are, after all, responsible for the decisions they make in their work!
Through our observations and interviews, we find that many participants (P02-04, P10, and P13) primarily record only the source code that produces the results they will use. E.g., P02, a HCI researcher used an R script to capture his analysis. The script contained the source code for loading dataset, subsetting the data, and the significance tests including post-hoc analysis. While it also contains comments capturing the rationale for test selection, e.g., "distributions not normal" and "parametric test is not valid", it did not capture the source code for it. This lowers the reproducibility of the analysis.
Participants are aware of the importance of reproducible research, but do not want to clutter their scripts as this might affect code navigation. Furthermore, as discussed earlier, hidden dependencies are prevalent in notebooks. Some participants reported encountering notebooks that do not execute because they had not copied all the dependencies when migrating code. Potential solutions include dependency managers, e.g., Drake, and tools that help find code snippets, e.g., Code Gathering Tools and Verdant.