ExamSummary
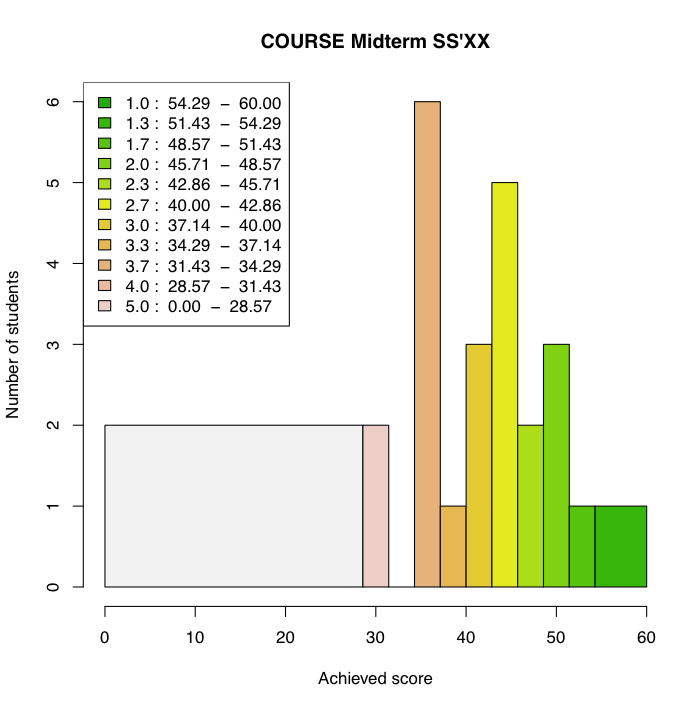
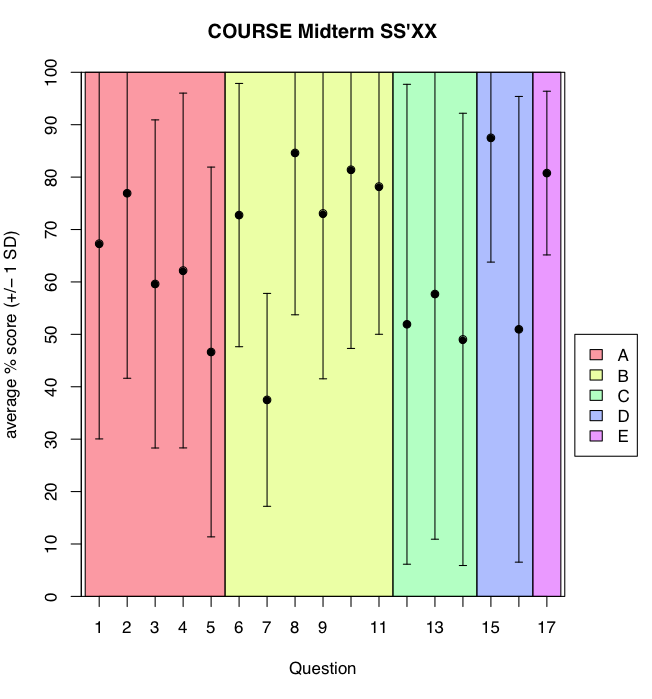
Exam scores - the points students got for each question in an exam - reflect both a student's performance, and how well a question is able to discriminate between different knowledge and skill levels. Visualizing these scores in the right way can help you check if your exam questions are problematic. ExamSummary visualizes the score in different ways. It currently includes a total score histogram showing how your students performed, and an average question score showing how your questions performed.
ExamSummary is currently maintained by Chat Wacharamanotham.
Visualization Examples
Download
- Source and example (version 1.2): Download
Git (internal)
git clone ssh://oliver.informatik.rwth-aachen.de/Public/Teaching/%20Templates/ExamSummary/ExamSummary.git