Blaze
Abstract
Understanding source code is crucial for successful software maintenance. A particularly important activity to understand source code is navigating the call graph. Programmers have developed distinct strategies for effective call graph exploration. We introduce Blaze, a source code exploration tool tailored closely to these strategies. In a study, we compare Blaze to Stacksplorer, a tool that visualizes the immediate neighborhood of the current method in the call graph, to a tool resembling the standard Call Hierarchy view in the Eclipse IDE, and to an unmodified Xcode installation. The call graph exploration tools significantly increased success rates in typical software maintenance tasks, and using Stacksplorer or Blaze significantly reduced task completion times compared to using the Call Hierarchy or Xcode.
How it works
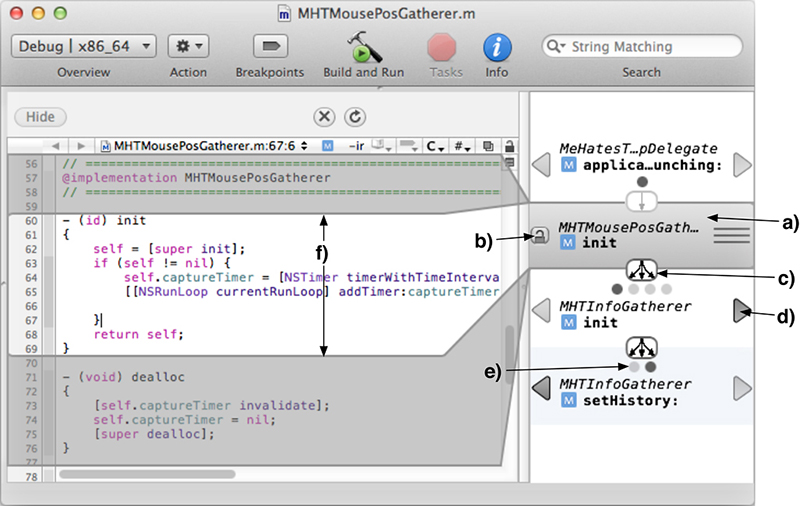
- Blaze adds a view on the right side of the source code editor.
- It shows one path through the call graph including the focus method (a).
During Phase 1:
- Focus method = Method currently edited
- Focus method & displayed path change when navigation happens in the editor.
- The focus method is unlocked (b).
- Result: Blaze provides additional information scent.
During Phase 2:
- The focus method does not change automatically.
- The focus method is locked (b).
- Result: Blaze allows exploring all paths that include the focus method.
Integration with the editor:
- Graphical overlays (f ) connect the currently edited method with the corresponding item on the path.
- Clicking a method on the path navigates to this method.
Exploring different paths:
- Entries below (above) the focus method can be exchanged with other callees of the preceding (following) method.
- Clicking the arrow between two entries (c) reveals all options.
- Clicking the arrows next to the entries (d) switches to the next/previous alternative.
- “Line-of-dots”-style page indicators (e) show the number of options and the current selection.


